Sales is an outcome based function. This means that when we sell something, we deliver an outcome (additional revenue). Most business owners measure revenue but fall short when it comes to setting targets for the activities and leading indicators that will produce the sales outcomes.
How am I going to hit my sales number?
We like to start at a high-level with the sales funnel. There are many different types of sales and marketing funnels that exist, but for simplicity we are going to focus on a very basic sales funnel for a services or technology business.
Sales Funnel
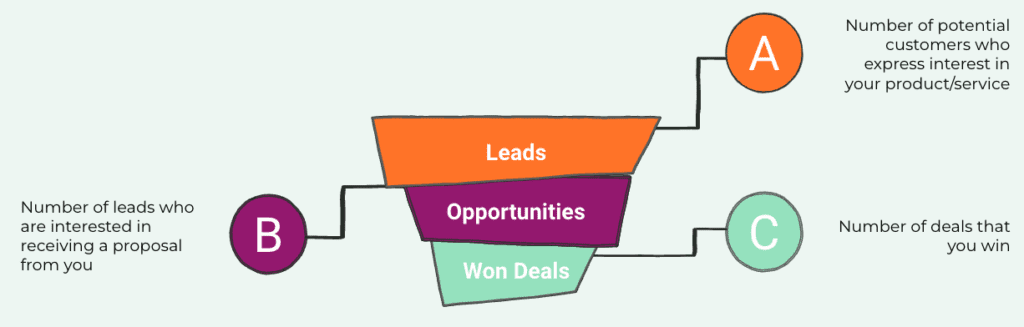
In this example sales funnel we are breaking out 3 buckets:
A: Leads are the number of potential customers who express interest in your product/service. In this example, we are not talking about the size of the market that COULD buy your product or service, but instead we are demonstrating the number of people who raise their hand to express interest in speaking with you or someone on your team about doing business with you.
B: Opportunities are the number of leads who are interested in receiving a proposal from you. In other words, these are people have been “qualified” and you have an opportunity to produce a proposal and present pricing for your product or service.
C: Won Deals are the number of deals that you win. This could either be a brand new customer, or even selling an additional product or service to an existing customer.
Progressing through the funnel: conversion rates
You’ll note in the funnel image above that each bucket gets a little smaller. This is because not every lead is going to be qualified to buy or will want a proposal, and not every proposal you make is going to result in a sale.
When a Lead becomes and Opportunity we refer to that as a “Lead Conversion” and when you collect data about the number of leads and opportunities, over time you can determine your “Lead Conversion Rate”.
Lead Conversion Rate = # Opportunities / # Leads
Example Lead Conversion Rate: 100 leads that resulted in 20 opportunities. 20 / 100 = 20% lead conversion rate
When an Opportunity is Won we refer to that as a “Close Rate”.
Close Rate = # Deals Won / # Opportunities
Example Opportunity Close Rate: 25 opportunities that resulted in 10 deals won. 10 / 25 = 40% Close Rate.
Use the Revenue & Activity Planning Calculator
If you have been struggling to figure out how to take your revenue growth goal and break it down into manageable chunks, try using our handy calculator.
How can you use the revenue and activity planner information?
The data will set you free! As we said at the beginning of this post, Sales is an outcome based function. In order to drive sales, you need opportunities, and in order to create opportunities you need leads.
This calculator is not the answer to all your problems, but rather a simple tool to help you determine where you need to start and what parts of your process you need to focus on.
If you need 150 leads but you haven’t been able to produce those types of results in the past, then perhaps you need to invest in new lead generation activities.
Or perhaps you have plenty of leads but your lead conversion rate is low, maybe you need to either focus on improving the quality of your leads or look at your sales process to identify opportunities to improve the process or even the capabilities of the team.
This is a journey, and in order to help on the journey you need access to good data and scalable processes.
Want to see how KPI can help you create a plan to achieve your revenue goals?
If you want to chat about how KPI can help you unlock value for your business by breaking long-term goals into short term activities, schedule a time to chat below.